We’ve recently completed two new significant additions to opentaps: Green Button XML and OpenEEMeter. Green Button XML allows you to upload utility billing data, such as interval usage data from smart meters, into opentaps. OpenEEMeter is an open source project that can then help you perform Measurement & Verification (M&V) of your energy efficiency projects based on the meter data.
This video shows you what it looks like:
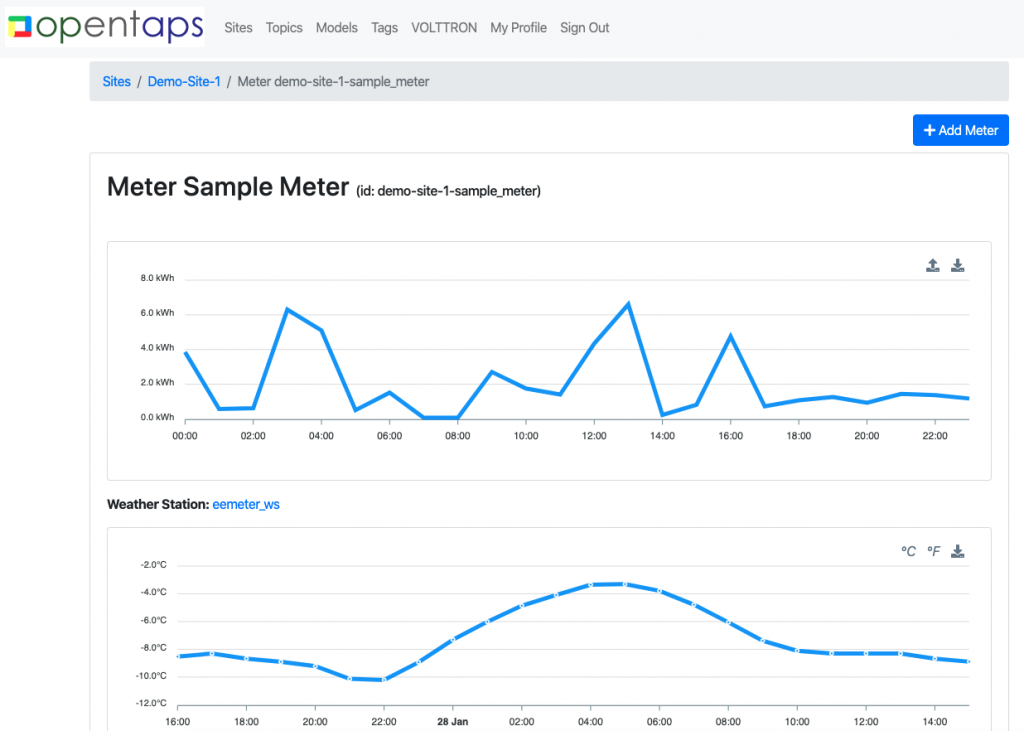
Here’s how it works: You can now set meters for your buildings or sites. The meter readings can then be uploaded either from a CSV or Green Button XML:

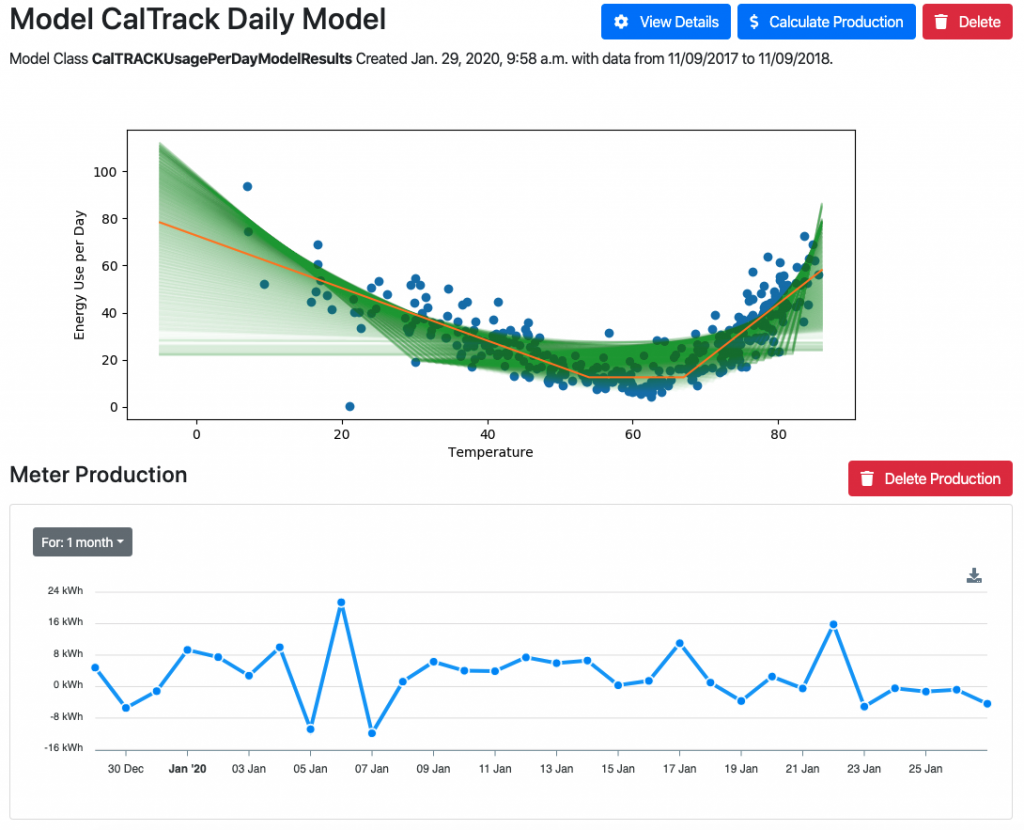
Once you have the meter data, you can use OpenEEMeter to create baseline or “counterfactual” models of energy usage for this meter. OpenEEMeter implements the CalTrack 2.0 standard for M&V and requires exactly one year (not more, not less) of energy data and can be run to create either hourly or daily models of your baseline energy use from meter data. It can then be used to calculate the difference of subsequent meter energy readings to determine the savings of your projects:

Note that we call the calculated energy savings “meter production” so that it could be compared on equal terms with energy produced by other energy assets, such as solar panels or storage batteries. So while it may at first counterintuitive to think of energy efficiency as “producing” energy, it is in fact a fundamental concept that we’ll keep repeating: Energy efficiency is an asset that produces energy.
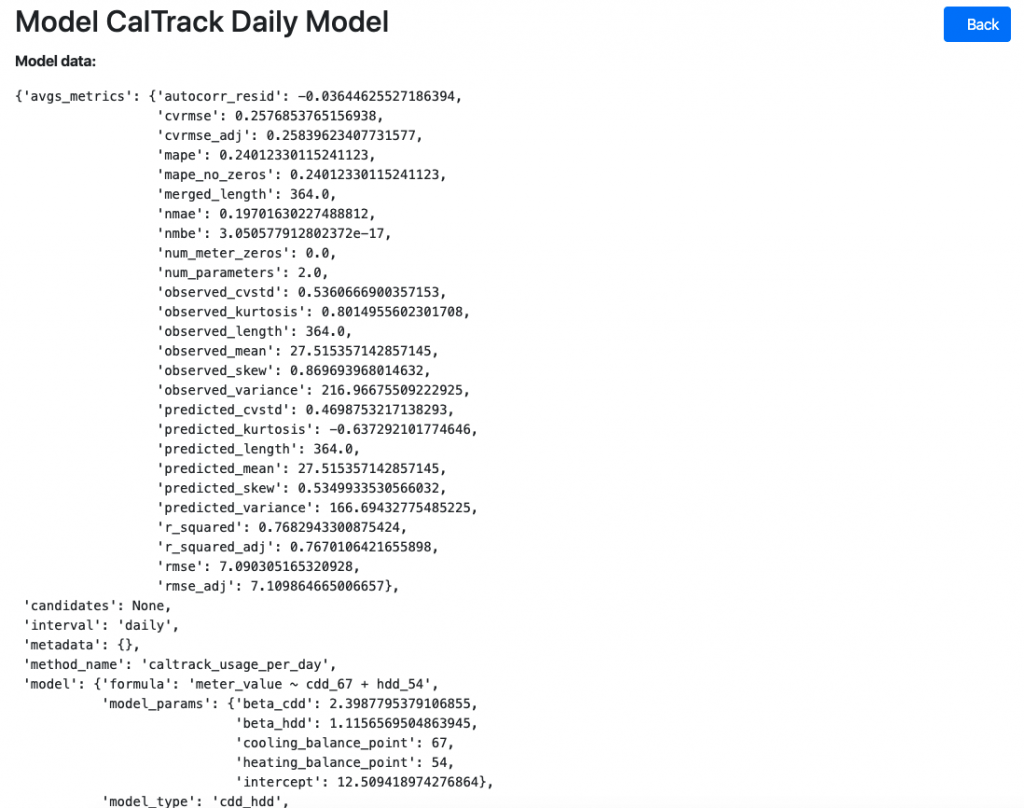
You can take a peak at the model produced by OpenEEMeter with the “View Details” button:

Yeah, I knew how to do that too. 🙂
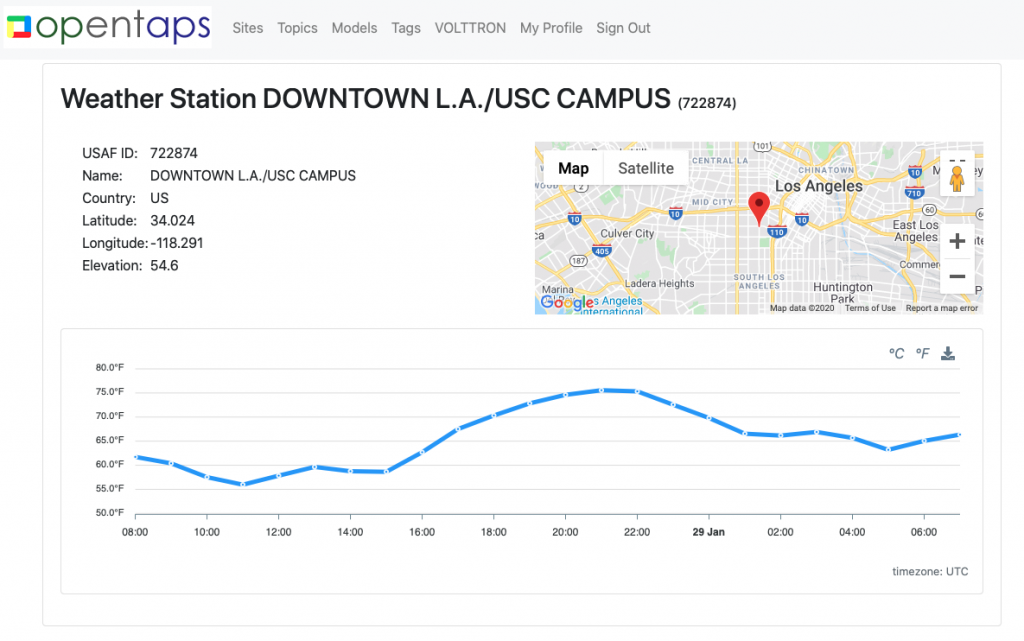
Finally, another nice feature of OpenEEMeter is that it has an OpenEEWeather component for getting weather information from the NOAA Integrated Surface Database:

When you create a new meter for your site, we’ve loaded all the USAF weather stations as seed data and will use OpenEEWeather to find the weather station nearest to your site.
Give us your feedback on our forum!